
📈 Communicate your results effectively with the best data visualizations
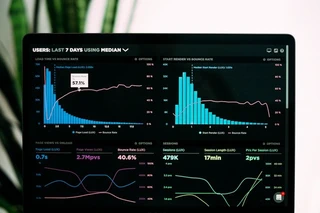 Image credit: Unsplash
Hugo Blox is designed to give technical content creators a seamless experience. You can focus on the content and Hugo Blox handles the rest.
Use popular tools such as Plotly, Mermaid, and data frames.
Embed Rich Content
HuggingFace Model
{{/* < embed platform=“huggingface” resource=“google/embeddinggemma-300m” type=“model” > */}}
HuggingFace Dataset
{{/* < embed platform=“huggingface” resource=“fka/awesome-chatgpt-prompts” type=“dataset” > */}}
GitHub Repository
⚡ The Open Research Copilot. Build high-perf Portfolios, Lab Sites & Docs in Markdown + Jupyter. 100% Data Control. 🦫 数据科学家的开源 Copilot。一键部署 👇
Custom embed with manual data
A great resource for learning
Custom Images
Embed beautiful images from any source with Hugo image processing (Unsplash, custom URLs, etc.):

Beautiful data visualization workspace
You can also add images to any platform embed:

Charts
Hugo Blox supports the popular Plotly format for interactive data visualizations. With Plotly, you can design almost any kind of visualization you can imagine!
Save your Plotly JSON in your page folder, for example line-chart.json, and then add the {{< chart data="line-chart" >}} shortcode where you would like the chart to appear.
Demo:
You might also find the Plotly JSON Editor useful.
Diagrams
Hugo Blox supports the Mermaid Markdown extension for diagrams.
An example flowchart:
```mermaid
graph TD
A[Hard] -->|Text| B(Round)
B --> C{Decision}
C -->|One| D[Result 1]
C -->|Two| E[Result 2]
```
renders as
An example sequence diagram:
```mermaid
sequenceDiagram
Alice->>John: Hello John, how are you?
loop Healthcheck
    John->>John: Fight against hypochondria
end
Note right of John: Rational thoughts!
John-->>Alice: Great!
John->>Bob: How about you?
Bob-->>John: Jolly good!
```
renders as
An example class diagram:
```mermaid
classDiagram
Class01 <|-- AveryLongClass : Cool
Class03 *-- Class04
Class05 o-- Class06
Class07 .. Class08
Class09 --> C2 : Where am i?
Class09 --* C3
Class09 --|> Class07
Class07 : equals()
Class07 : Object[] elementData
Class01 : size()
Class01 : int chimp
Class01 : int gorilla
Class08 <--> C2: Cool label
```
renders as
An example state diagram:
```mermaid
stateDiagram
[*] --> Still
Still --> [*]
Still --> Moving
Moving --> Still
Moving --> Crash
Crash --> [*]
```
renders as
Data Frames
Save your spreadsheet as a CSV file in your page’s folder and then render it by adding the Table shortcode to your page:
{{< table path="results.csv" header="true" caption="Table 1: My results" >}}
renders as
| customer_id | score |
|---|---|
| 1 | 0 |
| 2 | 0.5 |
| 3 | 1 |
Interactive Buttons
Add engaging call-to-action buttons to your data visualization posts:
Basic Buttons
{{< button url="/" >}}Contact Us{{< /button >}}

{{< button url="https://plotly.com/python/" new_tab="true" style="secondary" >}}Learn Plotly{{< /button >}}
Styled Buttons for Data Actions
{{< button url="#" style="primary" size="lg" align="center" icon="chart-bar" >}}View Dashboard{{< /button >}}

{{< button url="/data/results.csv" style="outline" icon="document-arrow-down" >}}Download Data{{< /button >}}

{{< button url="https://github.com/HugoBlox" new_tab="true" style="ghost" icon="arrow-top-right-on-square" icon_position="right" >}}View Source Code{{< /button >}}
Multiple Aligned Buttons
{{< button url="https://jupyter.org/" new_tab="true" style="secondary" rounded="full" align="center" >}}Try Jupyter{{< /button >}}

{{< button url="https://colab.research.google.com/" new_tab="true" style="primary" rounded="full" align="center" icon="rocket-launch" >}}Open in Colab{{< /button >}}
Did you find this page helpful? Consider sharing it 🙌

I am currently a Ph.D. candidate at the Ai4City-Lab, Urban Governance and Design Thrust, Society Hub, The Hong Kong University of Science and Technology (Guangzhou), under the supervision of Prof. Wufan Zhao and Prof. Yuan Liu. Prior to this, I obtained my Master’s degree from the School of Geospatial Engineering and Science, Sun Yat-sen University, where I was advised by Prof. Wuming Zhang and Prof. Yiping Chen.
My research focuses on 3D visual perception, intelligent interpretation and processing of point cloud data, and multi-modal urban foundation models. I am particularly interested in bridging geometric understanding with semantic reasoning in large-scale urban environments, with an emphasis on open-vocabulary learning, training-free paradigms, and cross-modal fusion between 2D and 3D data.
My goal is to develop scalable, interpretable, and generalizable AI systems for urban analysis, enabling applications such as digital twin construction, urban scene understanding, and intelligent infrastructure management.